
Tuesday, July 28, 2015
Payload Tracker Antenna
This weekend I finished building the 2 meter dipole antenna for the ballon payload tracker. I was able to tune it and achieve a 1.2 to 1 SWR. I will be building the box soon and will re-verify the match on the box with everything in it as well.


Sunday, July 5, 2015
4th of July
Relaxing and enjoying the Independence Day weekend. I did work on getting Xen Server running. I have it running under Virtualbox. I have also installed a linux based Xenmanager on the Debian 8 host. It is Python based and had several dependencies. I hope to have time to experiment more with it.


Field Day 2015
Field Day went well except for the overcast conditions. I had not planned for this and thought my solar panel would provide me all the power I would need. I need to at least setup an external charge input for my DPN. I operated almost exclusively on 15 meters. I am thinking of being 100% HOMEBREW and QRP next year. Antenna may be a Moxon beam.


Tuesday, June 23, 2015
Field Day Logging
Field Day is next Saturday so I spent some time this last weekend preparing the logging PC's. We have been using the N3FJP logging package for years. It supports older PC's like the old Dell D600's that we use.


Saturday, June 13, 2015
APRS Balloon Payload 2
A small wood frame has been built for the APRS tracker that will be placed in a foam box. The GPS receiver is mounted at the top of the frame facing up and the transmitter and tracker boards are below. It is sitting on top of the battery pack. The plan is to use lithium AA batteries. The pack is a 6 cells which should deliver 9 volts.

I am working on the dipole antenna that will be mounted to the side of the foam box. I also need to setup a regulator for the transmitter since 9 volts exceeds it's max voltage.

I am working on the dipole antenna that will be mounted to the side of the foam box. I also need to setup a regulator for the transmitter since 9 volts exceeds it's max voltage.
Wednesday, June 10, 2015
APRS Balloon Tracker
This last weekend I lashed up the components for the new APRS balloon tracker. All the items were obtained from ArgentData:
Tracker3 Model T3-Mini
ADS-GM2 GPS Receiver
SRB MX145 Transmitter

With 5 volts running everything and the transmitter connected to a dummy load I had approximately 200 mW output. The T3 audio out was connected directly to the audio in on the transmitter. I have not yet verified the deviation level but I was able to decode with a local receiver. Later I connected the transmitter to my 2 meter ground plane and the tracker was heard on the APRS-IS network and here is the APRS.fi raw log:

Tracker3 Model T3-Mini
ADS-GM2 GPS Receiver
SRB MX145 Transmitter
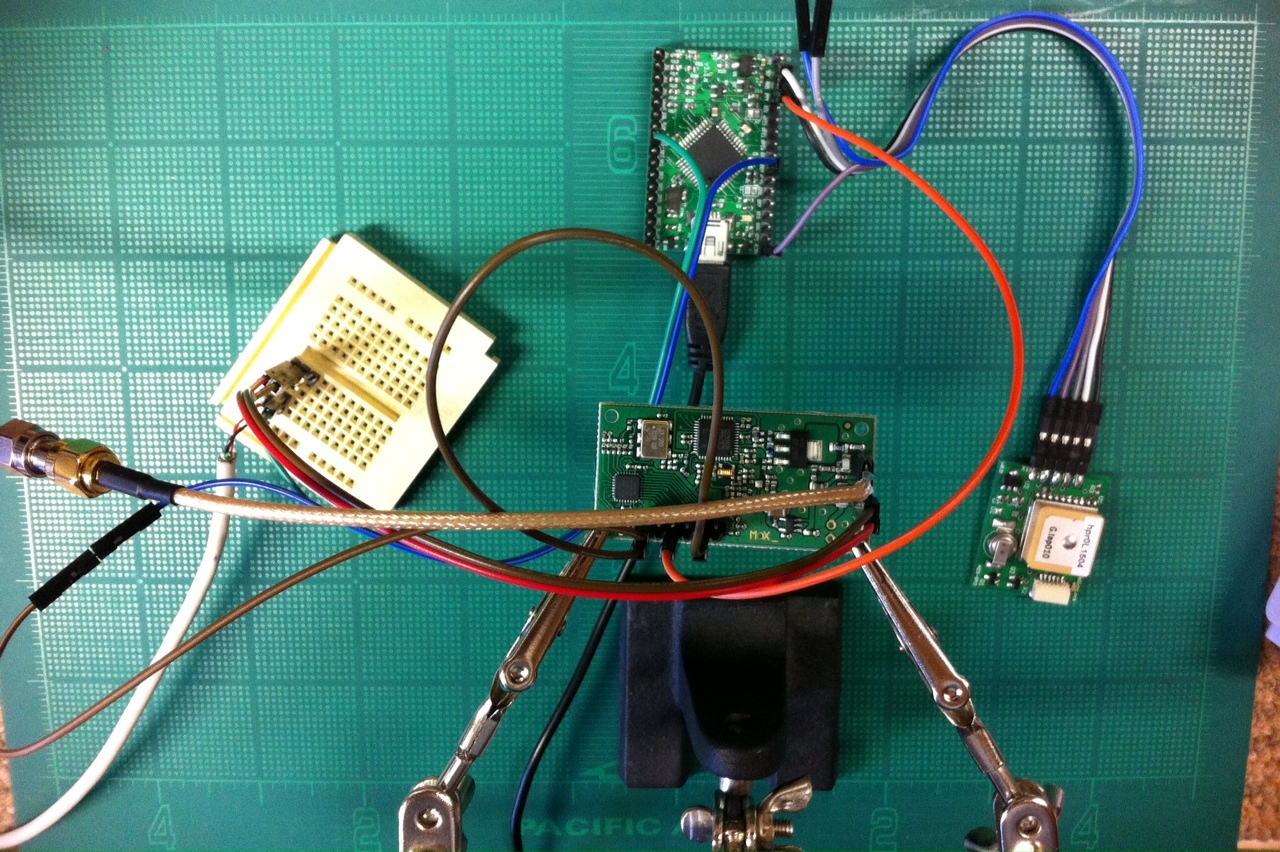
With 5 volts running everything and the transmitter connected to a dummy load I had approximately 200 mW output. The T3 audio out was connected directly to the audio in on the transmitter. I have not yet verified the deviation level but I was able to decode with a local receiver. Later I connected the transmitter to my 2 meter ground plane and the tracker was heard on the APRS-IS network and here is the APRS.fi raw log:

Next step is build a chassis to mount the boards in the payload box and to verify the deviation level. I have found a great method to measure deviation using a SDR dongle HERE.
Tuesday, May 19, 2015
ADS-GM2 GPS
I received my new GPS module from ArgentData ADS-GM2 that I will be using for a balloon tracker and decided to give it a bench test.

The connections are broken out in two ways. The connections on the left of the board are setup to mate to a DB-9 female or to the right with a 6 pin mini wafer connector. Since I will be using the RS-232 pins I decided to just use the DB-9 side. All the connection I need are on the top of the board so I used a .100 inch header soldered to the top of the board to break out the pins:
2 - RS-232 out
3 - RS-232 in
4 - Power
5 - Ground
Pin 1 is marked on the board as X1. I powered the board with 5 volts and connected my USB to RS-232 adapter to it and was able to see the serial NMEA sentences at 4800 baud on pin 2.
Just for fun I wanted to see the accuracy of this GPS module and had I found an interesting piece of freeware called VisualGPS. The software is designed to take the NMEA data from the GPS for a period of time while it is stationary and produce an analysis of the variations. The following is the analysis after about 12 hours.

It is interesting to see the variance over time. The GPS system is very complex and many calculations are made, both in the GPS module and in the system as a whole via the ground stations and uplinked via the satellite messaging.
The NMEA strings contain position information of the satellites which VisualGPS can also plot:

As well as a coverage plot:

The longer you collect data the more complete the plot will become. This can be useful for evaluating the antenna and the orientation of the antenna.

The connections are broken out in two ways. The connections on the left of the board are setup to mate to a DB-9 female or to the right with a 6 pin mini wafer connector. Since I will be using the RS-232 pins I decided to just use the DB-9 side. All the connection I need are on the top of the board so I used a .100 inch header soldered to the top of the board to break out the pins:
2 - RS-232 out
3 - RS-232 in
4 - Power
5 - Ground
Pin 1 is marked on the board as X1. I powered the board with 5 volts and connected my USB to RS-232 adapter to it and was able to see the serial NMEA sentences at 4800 baud on pin 2.
Just for fun I wanted to see the accuracy of this GPS module and had I found an interesting piece of freeware called VisualGPS. The software is designed to take the NMEA data from the GPS for a period of time while it is stationary and produce an analysis of the variations. The following is the analysis after about 12 hours.

It is interesting to see the variance over time. The GPS system is very complex and many calculations are made, both in the GPS module and in the system as a whole via the ground stations and uplinked via the satellite messaging.
The NMEA strings contain position information of the satellites which VisualGPS can also plot:

As well as a coverage plot:

The longer you collect data the more complete the plot will become. This can be useful for evaluating the antenna and the orientation of the antenna.
Subscribe to:
Posts (Atom)